LogBlast
A blazing-fast CLI log analyzer that processes multi-GB files in seconds — streaming parsing, smart format detection, anomaly alerts, and beautiful output.
What it does
Everything grep can't.
LogBlast combines the raw speed of streaming I/O with the intelligence of a purpose-built log tool — no scripting required.
Streaming architecture
Uses a BufReader pipeline — never loads the entire file into memory. RAM stays flat at ~12 MB whether the log is 100 MB or 10 GB. Benchmarked at over 200 MB/s on commodity NVMe hardware.
Rust BufReaderComposable filtering
Filter by log level, time range, regex pattern, IP address, and HTTP status code or range
— all at once. Combine any number of filters and invert them with --invert.
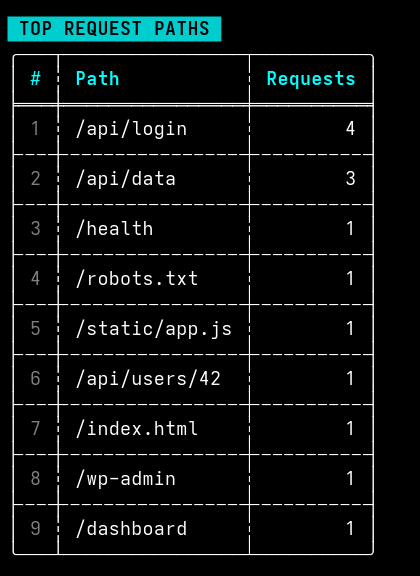
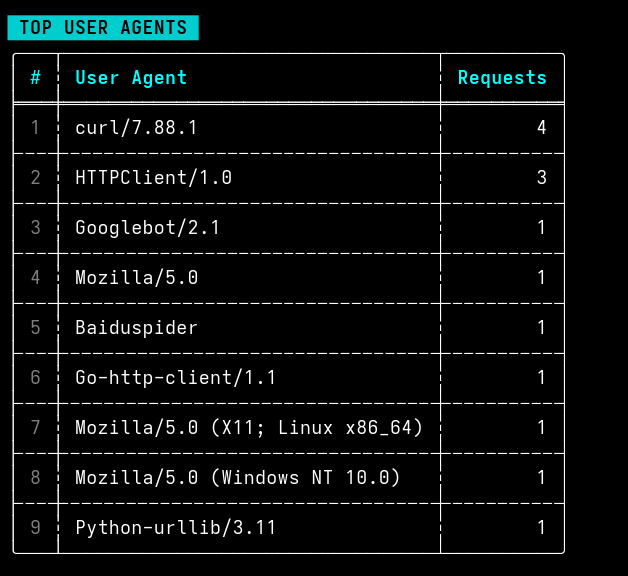
Rich statistics
Per-level breakdowns with visual bars, top N IPs, top paths, top user agents, and byte
stats. All displayed in color-coded tables via comfy-table. Configurable --top N.
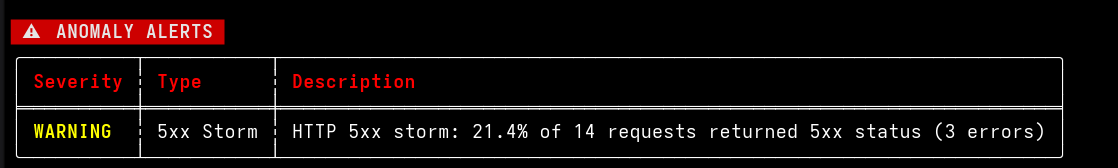
Anomaly detection
Automatically flags error spikes, IP bursts, and HTTP 5xx storms against configurable
thresholds. Set custom per-minute limits in your YAML config or via --spike-threshold.
CSV & JSON export
Convert any log format to structured CSV or NDJSON with a single --out flag. Pipe results into your BI tool, S3 bucket, or data pipeline downstream.
Stdin support
Pass - as the file argument to read from stdin. Works
seamlessly in shell pipelines with cat, tail -f, and
ssh remote | logblast filter -.
YAML config file
Save reusable filters, anomaly thresholds, and custom regex patterns in logblast.yaml. Auto-loaded from the working directory — no flags needed for your
standard setup.
Format auto-detection
Instantly recognizes Nginx/Apache CLF and Combined formats, structured NDJSON, and
plain-text logs with mixed timestamp styles — no --format flag needed.
Command reference
Four focused subcommands.
Each command does one thing well. Compose them in shell scripts or use them interactively.
logblast.yaml config file in the current
directory with commented defaults for every available option.Performance
Numbers, not claims.
Benchmarked on AMD Ryzen 7 5800X, NVMe SSD, Linux. Memory stays constant regardless of file size due to streaming.
// Comparison — 1 GB Nginx access log
// Scale test — Nginx format
Supported formats
Auto-detected. No config required.
LogBlast sniffs the format from the first few lines. Override with --format auto|nginx|json|text if needed.
Nginx / Apache
Common Log Format and Combined Log Format. Extracts IP, timestamp, method, path, status code, bytes, referer, and user agent.
JSON / NDJSON
One JSON object per line. Fuzzy-matches common field names for timestamp and log level across frameworks.
Plain text
Handles mixed timestamp formats including ISO 8601, syslog, and common app logger patterns. Extracts level from inline keywords.
In action
Real terminal output.
No mockups — these are actual screenshots from LogBlast running on real log files.
Configuration
One YAML file. Reusable everywhere.
Drop a logblast.yaml in any directory and it's auto-loaded on every
run. Scaffold one with logblast init-config.
Roadmap
What's next.
Shipped features are stable and tested. Upcoming items are actively in development or planned for v1.x.
Streaming BufReader engine
Constant-memory parsing regardless of file size
Anomaly detection
Error spikes, IP bursts, 5xx storms with configurable thresholds
CSV & JSON export
Structured output for downstream pipelines and BI tools
YAML config file
Reusable filters, thresholds, and custom regex patterns
logblast tail — live tail with filtering
Real-time log monitoring with all filter flags applied on the fly
Gzip / zstd compressed log support
Analyze rotated compressed logs without decompressing first
Multi-file glob — logblast analyze logs/*.log
Aggregate stats and anomalies across an entire log directory
Terminal histogram — time-series error rate
Sparkline chart of errors per minute rendered inline in the terminal
PDF summary report export
Share a formatted analysis report without sharing raw log data
Plugin system for custom parsers
Extend LogBlast with your own format parsers and output plugins
Pricing
One-time payment. Lifetime access.
Pay once, get all current and future v1.x updates. No subscription, no telemetry, no nonsense.
one-time payment
$29
Lifetime access · All platforms included · No recurring fees
Questions? Reach out on Telegram: @DevEcho